Who this is for
If sensor data only reaches the dashboard when connectivity is perfect, the design is the problem, not the sensors.
You probably need this if…
- Unplanned machine downtime keeps disrupting production.
- Energy costs are rising with no visibility into where it's used.
- Valuable assets go missing or are hard to locate on site.
- Staff are still taking manual readings and logbooks.
- Maintenance only happens after equipment has already failed.
- There's no early warning before equipment actually breaks down.
Where it applies
Probably not the right fit when…
- A one-off sensor need with no dashboard, alerting or integration requirement.
- A very small site where manual checks are still genuinely practical.
Technical overview
A useful IoT system is a data pipeline from sensor to decision. Reliability depends on radio design, edge handling of disconnects, and securing every device identity.
Technologies we work with
Reference architecture
Design principles
- Specify sensor accuracy, calibration, sampling interval, environmental rating and maintenance needs against the operational use case.
- Separate IoT devices, gateways, management interfaces and enterprise applications into controlled security zones.
- Use device identity, authenticated encrypted transport, credential rotation and explicit topic-level permissions for messaging.
- Define offline buffering, duplicate handling, timestamps, alert thresholds and data-quality checks before relying on dashboards.
Specification baseline
| Aspect | Specification | Why it matters |
|---|---|---|
| Connectivity | Choose BLE, Wi-Fi, LoRaWAN, NB-IoT or wired connectivity from payload size, power budget, coverage and latency | Radio range and battery life depend on environment and operating profile. |
| Messaging | Use MQTT with TLS, authenticated clients, access-controlled topics and explicit delivery semantics | Transport encryption and identity controls protect device-to-platform communication. |
| MQTT QoS | QoS 0 is at-most-once, QoS 1 is at-least-once, and QoS 2 is exactly-once delivery within the MQTT protocol exchange | Applications must still handle business-level duplicates, ordering and persistent state. |
| Edge processing | Buffer telemetry locally when links are intermittent and define timestamp and replay behaviour | Store-and-forward supports continuity during connectivity outages. |
| OT security | Apply Purdue-model zoning where appropriate and IEC 62443-aligned controls to industrial deployments | Industrial segmentation reduces the risk of cross-zone compromise. |
| Data quality | Record units, calibration state, device identity, timestamps and missing-data indicators | Operational analytics depend on telemetry with defined meaning and quality. |
Key design decisions
Processing location
Connectivity is dependable and central analytics, fleet management and cross-site visibility are priorities.
Local response, bandwidth reduction, data buffering or continued operation during WAN outages is required.
Wireless connectivity
Local infrastructure is available and throughput, proximity or short-range connectivity fits the use case.
Low-power telemetry over wider areas matters more than high throughput or very low latency.
Sizing & calculations
Daily telemetry volume = device count × messages per device per day × average payload size.
1,000 devices sending 288 messages daily with a 200-byte payload generate 57.6 MB of raw payload per day before protocol overhead and indexing.
Average message rate = device count × reporting frequency in messages per second per device.
5,000 devices each reporting once per minute generate approximately 83.3 messages per second on average.
Battery-life estimate = usable battery capacity divided by average current draw, adjusted for duty cycle, conversion losses, temperature and ageing.
A hypothetical usable 2,000 mAh battery at an average 2 mA draw gives 1,000 hours, or about 41.7 days, before real-world derating.
Standards, protocols & references
Handover documentation
- Sensor and gateway inventory
- Connectivity and network-zone diagrams
- Device identity and credential-management procedures
- MQTT topic, schema and QoS register
- Dashboard, alert and data-retention configuration
- Offline recovery and operational support runbook
What you get
- A device and data pipeline that survives connectivity drops
- Energy, occupancy or machine data turned into alerts, not raw logs
- IoT traffic isolated from the core IT network
What we deliver
Sensors & devices
- Industrial and environmental sensors
- RFID / BLE asset tracking
Connectivity
- Wi-Fi, BLE and LoRaWAN
- Cellular (4G / 5G, NB-IoT)
Edge & platform
- Edge computing and data ingestion
- MQTT / OPC-UA integration
Smart buildings
- Energy and environment monitoring
- Occupancy and space analytics
Industrial IoT & OT
- Machine and line monitoring
- Predictive maintenance
Analytics & security
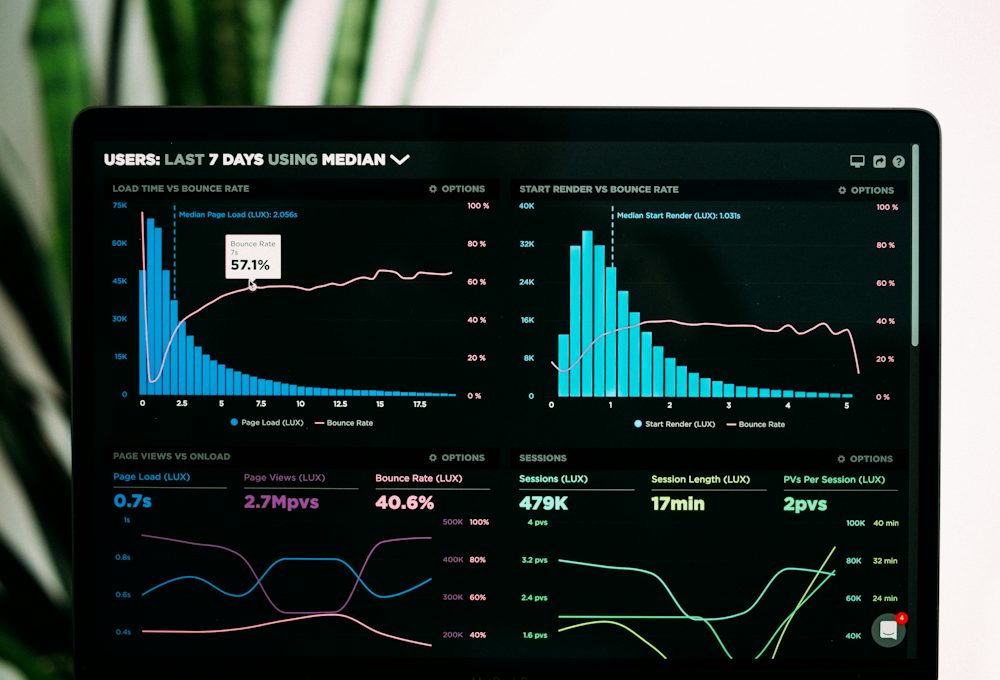
- Unified dashboards and alerts
- Device identity and segmentation